Page 2 of 25
Prosperity Now Scorecard – Custom Reports
Use the tools here to download reports and graphics summarizing the data for your state or local area and the strengths and weaknesses of your state’s policies. You can create and customize data and policy reports that you can share with stakeholders or use as “leave-behinds” when meeting with policymakers. You can also create graphics that break down state policy adoption as well as data by race and over time, which can easily be inserted into reports or presentations. You can also create data tables that allow you to download the Scorecard data in table format.
Tags: Data Source, Tools and Tutorials
July 23, 2024
Part 3: Project GROWS Links Individual Success with a Vision for Systems Change
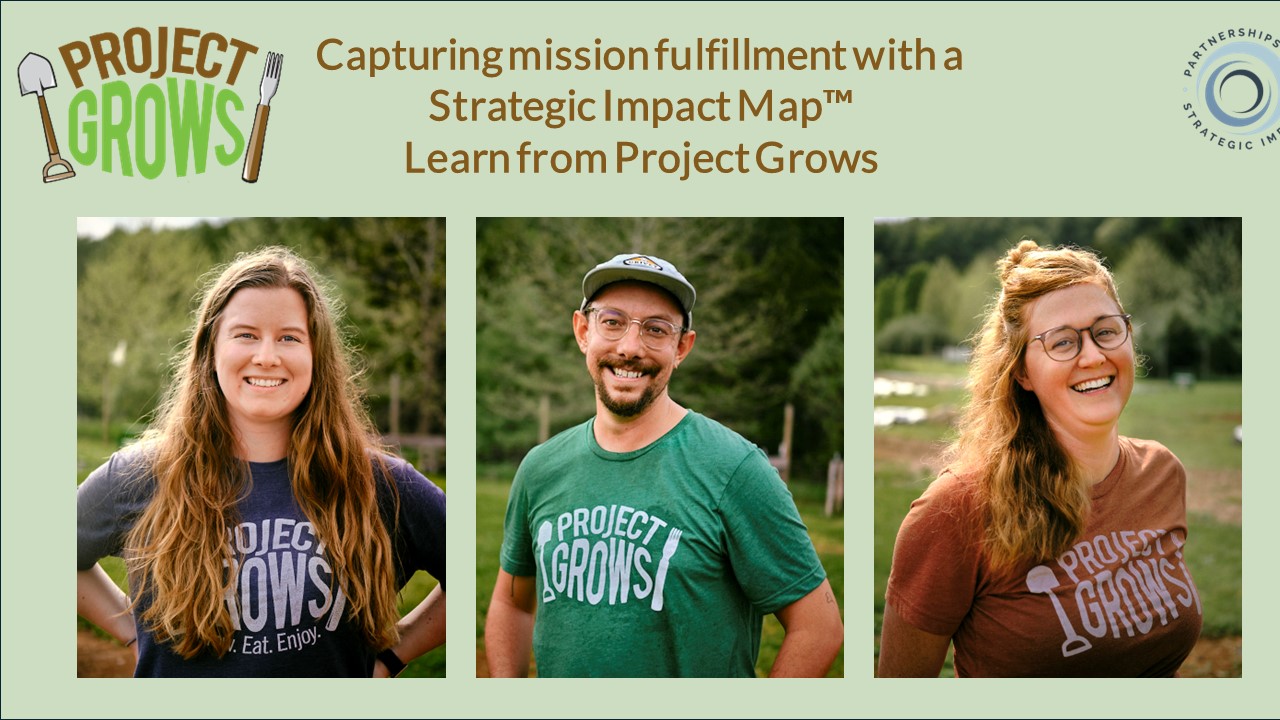
Project GROWS uses their Strategic Impact Map™ to plan out how they track mission fulfillment. This is a second blog about the first step of the ImpactStory™ Strategy – and how creating a Solid Framework provides the basis for telling powerful impact stories.

June 4, 2024
VIDEO: Part 3 – Linking Individual Success to Systems Change Project GROWS
VIDEO: Project GROWS uses their Strategic Impact Map™ to plan out how they track mission fulfillment. This is a second blog about the first step of the ImpactStory™ Strategy – and how creating a Solid Framework provides the basis for telling powerful impact stories.

Part 2: Project GROWS’ Tracks Mission Fulfillment
Project GROWS uses their Strategic Impact Map™ to plan out how they track mission fulfillment. This is a second blog about the first step of the ImpactStory™ Strategy – and how creating a Solid Framework provides the basis for telling powerful impact stories.

May 6, 2024
VIDEO: Part 2: Project GROWS’ Tracks Mission Fulfillment
VIDEO: Project GROWS uses their Strategic Impact Map™ to plan out how they track mission fulfillment. This is a second blog about the first step of the ImpactStory™ Strategy – and how creating a Solid Framework provides the basis for telling powerful impact stories.

Part 1: How Project GROWS Sets Up Their Impact Story
A Strategic Impact Map™ is an improvement on traditional logic models. While traditional logic models are focused on “inputs” (i.e., the resources nonprofits are seeking from funders), a Strategic Impact Map™ starts with what’s most important to the social sector, which is Mission. Learn about Strategic Impact Maps™ by learning about how Project Grows created theirs.

April 24, 2024
VIDEO: Part 1: How Project GROWS Sets Up Their Impact Story
VIDEO: A Strategic Impact Map™ is an improvement on traditional logic models. While traditional logic models are focused on “inputs” (i.e., the resources nonprofits are seeking from funders), a Strategic Impact Map™ starts with what’s most important to the social sector, which is Mission. Learn about Strategic Impact Maps™ by learning about how Project Grows created theirs.

A Transformation of Program Evaluation
I have transformed traditional program evaluation into a first-of-its-kind framework and toolbox you can use day-to-day to track mission fulfillment and iteratively improve programs, separately or collaboratively together. Read about the ImpactStory™ Strategy and my upcoming book!

- Blog - Extras
- Blog - Masterful Data Viz
- Blog - Masterful impact Stories
- Blog - Powerful Data Analysis
- Blog - Programming that Works
- Blog - Simple Data Collection
- Blog - Solid Framework
- Blog - Uncategorized
April 8, 2024
VIDEO: A Transformation of Program Evaluation
VIDEO: I have transformed traditional program evaluation into a first-of-its-kind framework and toolbox you can use day-to-day to track mission fulfillment and iteratively improve programs, separately or collaboratively together. Read about the ImpactStory™ Strategy and my upcoming book!

Are Anonymous Surveys Necessary?
Learn about different ways a survey can be anonymous, including the pros and cons of each.

March 25, 2024
Page 2 of 25
